Most nonprofits have two things in common: No matter their vertical, they all aim to fulfill their missions and positively impact their communities. To do this, your team works together to raise support and allocate donations wisely.
Your nonprofit’s annual report is the perfect opportunity to provide an overview of these activities. It bridges the gap between your yearly operations and overall mission to provide a recap for your staff and keep constituents such as volunteers, corporate partners, and donors engaged.
In this guide, we’ll explore three essential sections that every nonprofit annual report should include:
- Donor growth
- Financial activity
- Program efficiency
Don’t think of this as just another version of Form 990—your annual report tells the story behind the numbers through testimonials and impact stories that show what your nonprofit is all about. Use the following tips to effectively bring your data to life.
1. Donor Growth
From writing effective outreach messages and carefully asking for donations, your nonprofit spends a lot of its resources cultivating supporter relationships. After all, donors’ contributions drive your mission forward. Their generosity allows your nonprofit to stay active and make an impact.
Since your nonprofit’s productivity is so closely tied to its donor support, your annual report should include insight into their involvement. Here are some metrics your annual report should highlight:
- Donor growth rate: Celebrate the expansion of your nonprofit’s support by emphasizing how many new donors were acquired. Calculate your donor growth rate, which is the difference between last year’s donors and this year’s, divided by the number of donors your nonprofit had last year and multiplied by 100.
Donor Growth Rate = (# of total donors this year - # of total donors last year / # of total donors last year) x 100
- Donation growth rate: To compare gift sizes across years, follow the same formula used to calculate donor growth rate, but input the total amount of donations for the years in question. That way, you can identify any outliers, patterns, or specific areas of growth in giving patterns.
Donation Growth Rate = (# of total donations this year - # of total donations last year / # of total donations last year) x 100
- Donor retention rate: Your annual report should acknowledge the loyal supporters who continually make your work possible. Calculate the donor retention rate by dividing this year’s number of donors by last year’s and share the percentage.
Donor retention rate = (# of donors this year / # of donors last year) x 100
- Fundraising ROI: For all that your nonprofit invests in donor acquisition and fundraising campaigns, your annual report should demonstrate whether or not those efforts are paying off. Divide your total costs for the year by your total funds raised for a broad overview of your fundraising success. To get even more specific, apply this formula to specific fundraising campaigns. For example, Double the Donation’s fundraising statistics show that nonprofits saw a $2.75 return for every dollar spent on search ads.
Fundraising ROI = total costs for this year / total funds raised
Think of these details as the introduction to your report—you’re setting the stage to explain how your work was funded. These metrics provide a helpful overview of the support your organization receives, which places the focus of your report on the community that empowers your work.
-
Financial activity
Your organization may already employ effective nonprofit bookkeeping to properly budget its funds and streamline its annual tax filings. However, organized bookkeeping also prepares your organization to compile a comprehensive annual report that doesn’t leave anything out, explaining where every dollar went. A few things to note include:
- Revenue: List your total revenue for the year, pointing readers back to the donation metrics to learn more about where the revenue came from.
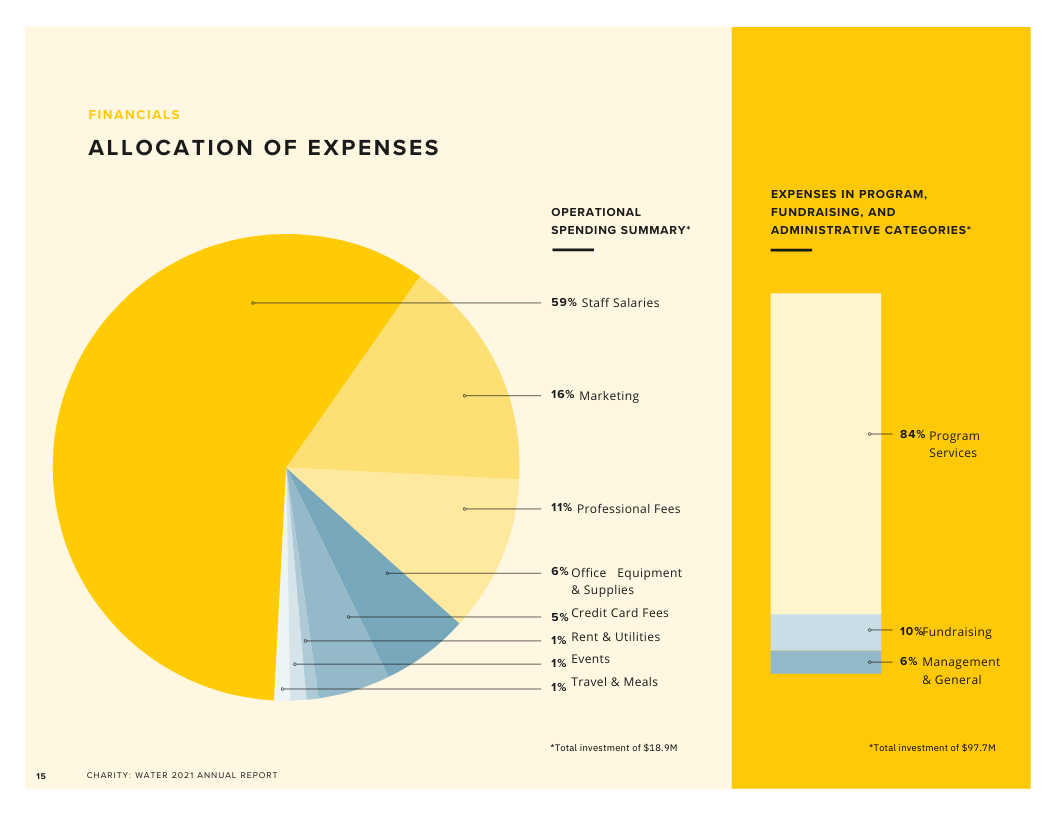
- Expenses: Note how much money you spent and include other important details that your stakeholders will need to know. Where was the money spent? How was it dispersed across overall expenses? For example, consider how charity:water’s annual report details their allocation of expenses in a comprehensive pie chart.
- Operating surplus or deficit: Compare your revenue and expenses to determine the health of your overall budget. Overspending and underspending alike can signal faulty financial planning, so it’s important to explain any gaps in your budget and how you plan to reconcile them.
- Future forecasts: Estimate your projected revenue for the coming year, then use that as a segue to explain where your nonprofit is going and its strategy moving forward. Include any plans for growing your revenue, lowering your expenses, or otherwise making improvements to the financial activity you’ve just described.
Providing these details will bolster donor trust since they prove your nonprofit uses its contributions ethically. Additionally, it shows constituents where your organization needs the most help, enabling them to support your mission next year in specific and meaningful ways.
-
Program success
From the technology that streamlined your work to the corporate sponsors who partnered with your nonprofit, there were many helping hands that contributed to this year’s accomplishments. This is where your annual report transforms from a record book of activity into a practical explanation of your organization’s impact.
According to Foundation Group’s guide to starting a nonprofit, the IRS uses Form 1023 to determine whether organizations are truly formed to fulfill their charitable purpose. In your annual report, stick to the basics you provided at this stage in your startup. In other words, what has your nonprofit set out to do from the beginning, and how did you accomplish that this year?
To illustrate your organization’s mission-centric efforts, provide details about:
- Program efficiency: Demonstrate how donors’ contributions made an impact by comparing program expenses to your total expenses. That way, donors will get a clearer picture of how donations are used and which activities they fund.
- Impact stories: After explaining your various programs, discuss how they benefited your overall mission. Note their accomplishments, using numbers and statistics for credibility. Also, use pictures and videos (if your report is digital) to bring to life the stories of people or places that were affected by your work.
- Beneficiary satisfaction: When sharing impact stories, don’t just speak from your nonprofit’s point of view. Allow beneficiaries to share their perspectives through testimonials and surveys. For example, Habitat for Humanity’s annual report includes pictures drawn by the children who live in homes built with Habitat’s help.
Remember to keep supporters at the forefront of your nonprofit’s story. After all, you can’t talk about your nonprofit’s work without explaining those who made it possible. Plus, donor and volunteer spotlights can humanize your annual report, especially when you include pictures, names, and details about their contributions.
When done the right way, your nonprofit’s annual report plays a huge role in strengthening relationships with its constituents. Most notably, it’s an opportunity to connect your nonprofit’s story to its data and help supporters see your work the way you see it. For example, your revenue is not just income (or a meaningless number), but a representation of the community’s investment in your organization’s goal.
Beyond your current donors, there is a wide network of potential supporters waiting to learn more about your nonprofit. Engage more of your community and increase support by transparently sharing your nonprofit’s data through an annual report.